

Hang in there
It can be difficult to ignore the noise, and your reduced portfolio value, when the stock market has a significant downturn. It can be even harder to stay invested when all the headlines are so negative and your portfolio is down big over a short period of time. Research shows you are often best served by not selling during a period of a large decline.
It took the S&P 500 INDEX just over 4 years to recover from the drawdown experienced during the Great recession of 2007-2009, at that time the largest drawdown the market experienced in over 40 years. The S&P 500 INDEX returned over 25% annually over the 5-year period from the bottom of the decline in 2009. More recently, it took less than 4 months for the S&P 500 INDEX to fully recover from the COVID-19 induced decline in early 2020.
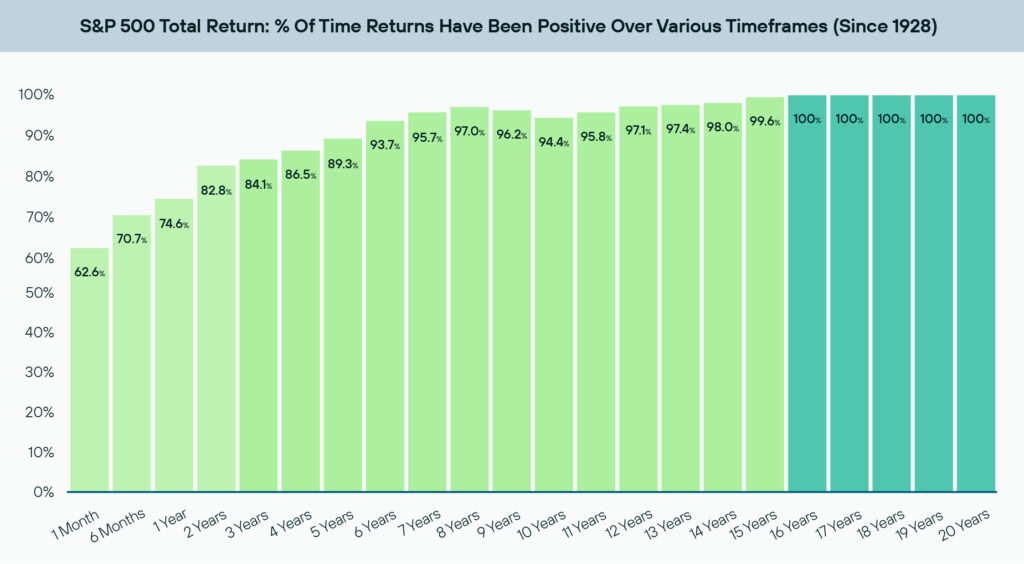
Since 1928, the S&P 500 INDEX generated a positive total return more than 89% of the time, over all 5-year periods. Those are good odds. When you extend the timeframe to 16 years, you’ll see that there’s never been a period where the S&P 500 INDEX didn’t generate a positive return.
It turns out that the stocks offering the best returns for investors historically experienced incredibly painful drawdowns. Morgan Stanley’s Michael Mauboussin and Dan Callahan recently studied the price behavior of 6,500 stocks. Among other things, they took a closer look at the 20 stocks with the best total shareholder returns over the 40-year period from 1985 to 2024.
They also reviewed the performance of the 20 worst performers during the period. (Note: They only considered stocks listed on the NYSE, NASDAQ and NYSE American exchanges that traded during the entire measurement period. They excluded companies worth less than $1 billion at the beginning and $250 million at the end of their maximum drawdowns.)
“The median maximum drawdown was 72% for the best group, and the median maximum drawdown duration, the time from peak to trough, was 2.9 years,” they found. “The median time to return to the prior peak (prior peak to trough to prior peak) was 4.3 years. The median annualized abnormal returns following the bottom were 8% for the next 5 years and 12% for the next 10 years. This is based on the unrealistic assumption the stock was purchased at the low.”
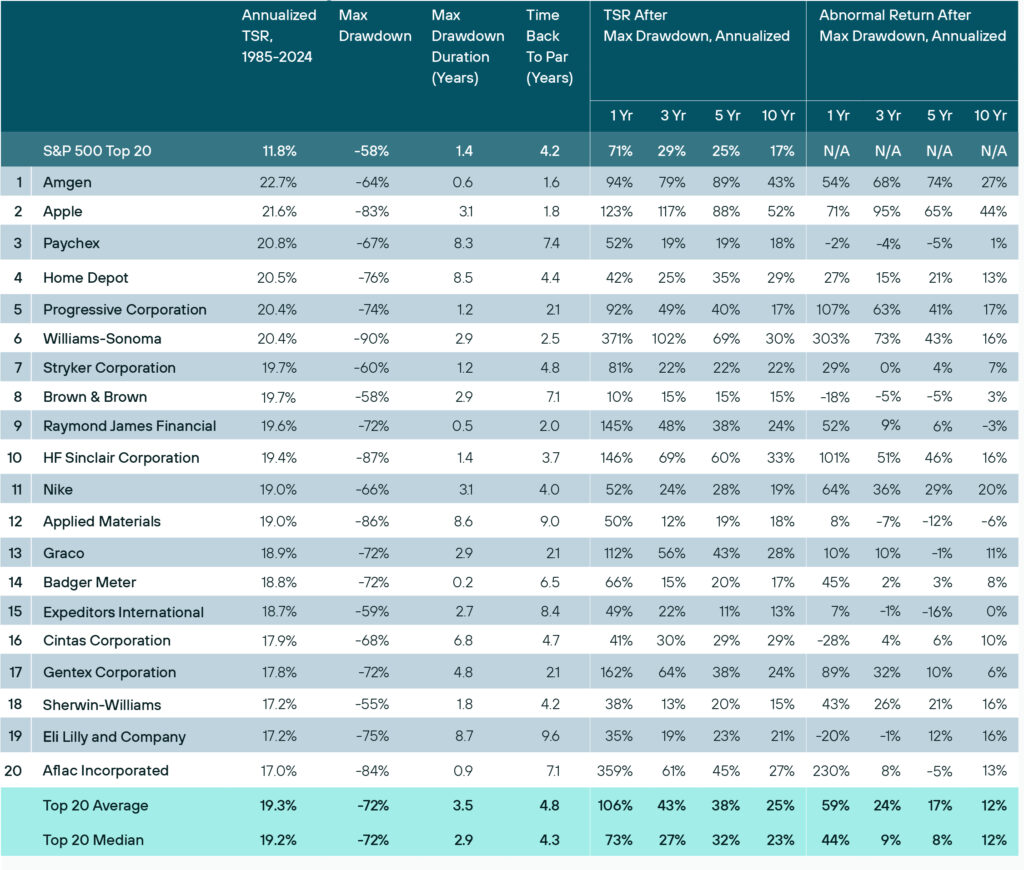
Conclusion: The best performing stocks over long periods of time can experience massive drawdowns that can last for years.
(Source: Morgan Stanley/Sam Ro).
The Morgan Stanley analysts considered the performance of the S&P 500 INDEX over the same 40-year period to show the benefits of diversification. The maximum drawdown for the index was 58%, the maximum drawdown duration (peak to trough) was 1.4 years, and the time to recover back to the prior peak was 4.2 years,” they observed. “Following the trough, the annual total shareholder return for the S&P 500 INDEX was 25% over 5 years and 17% over 10 years.”
(Source: Morgan Stanley/Sam Ro).
This is an excellent example of why diversification is important. It will help to smooth out your portfolio during times of increased volatility and lessen the risk of a single stock hurting your portfolio significantly, or God forbid, never coming back!
One of the many charts our research team at VestGen produces and reviews each month is a chart of the historical S&P 500 INDEX and all the 5% or greater market pullbacks. It is shown below. The message of the chart is to provide historical context to stock market pullbacks via a long-term view. The S&P 500 INDEX experienced a 19% pullback in February-April of 2025, however by July of 2025 recovered all that decline to reach a new all-time high.
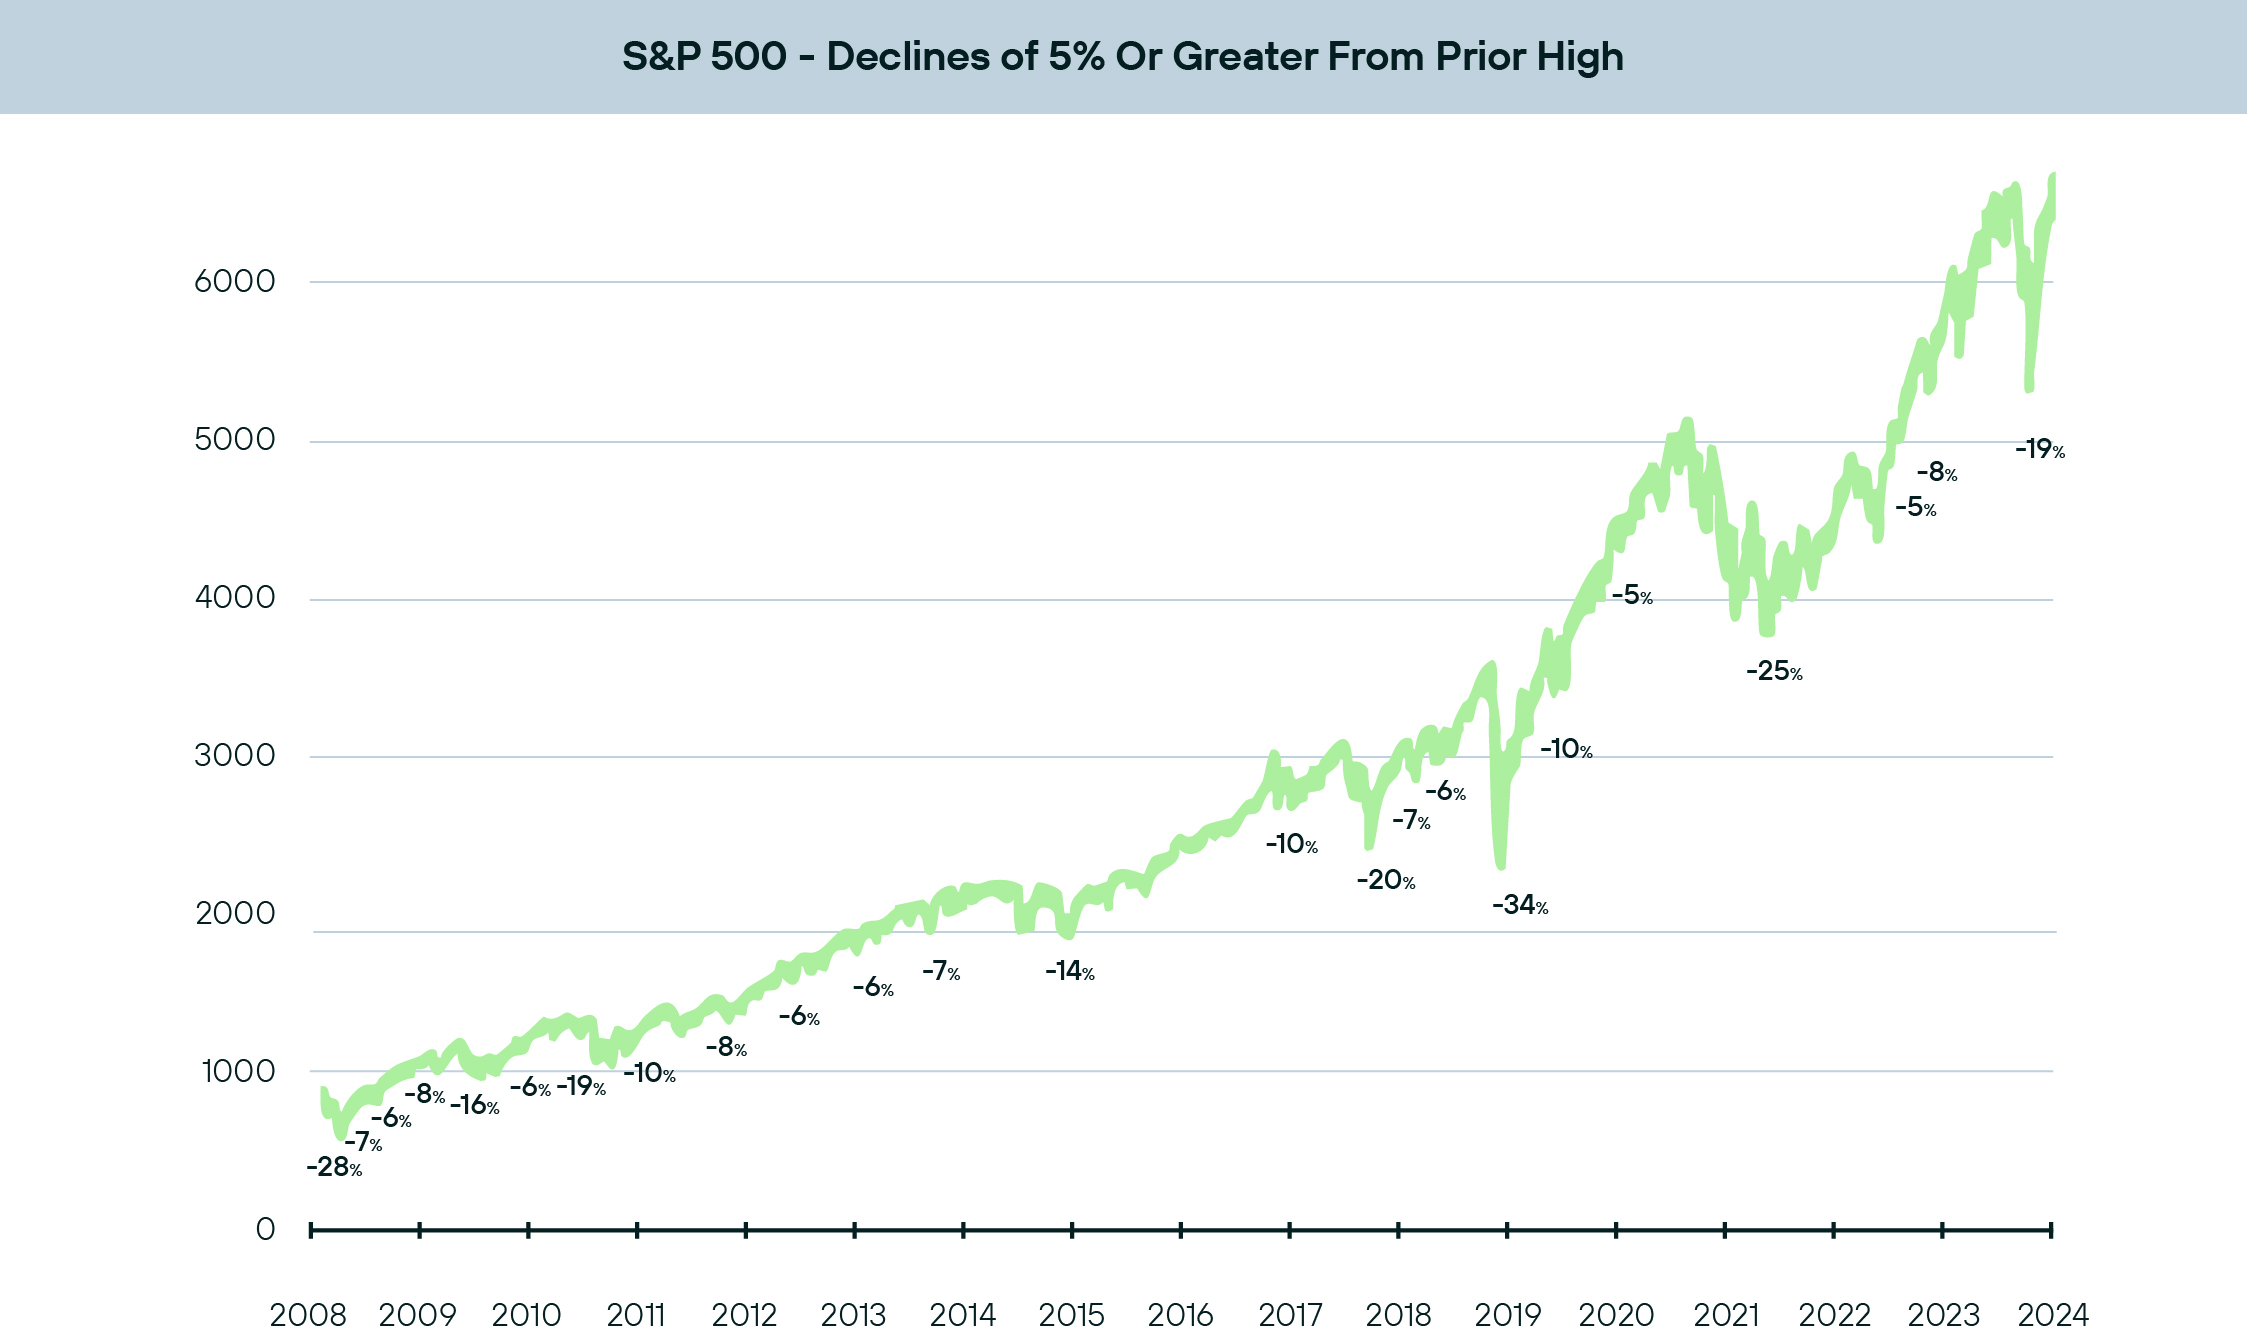
Timing the tops and bottoms of the market is a difficult thing to do. Often, by the time most investors start to panic and sell, a good portion of the decline has already occurred. There is also the risk of missing the recovery from the lows back to higher prices if you decide to sell during a decline. The recovery can often be strong and swift as we saw after both the pandemic decline in 2020 when the S&P 500 INDEX rallied over 9% in a single trading day, as well as early in 2025 when the S&P 500 INDEX also rallied over 9% in a single trading day on news of a 90-day pause in tariffs.
As the saying goes, “time in the market” beats “timing the market.” Knowing your investment time horizon, risk profile, and looking at market performance in this context can help you resist the impulse to sell in times of market volatility.
Commentary by VestGen Investment Management. VestGen Investment Management is an SEC registered investment adviser with its principal place of business in the State of New Jersey with offices at 3393 Bargaintown Rd., Egg Harbor Township, NJ 08234. Being a registered investment advisor does not imply any level of skill or training. VestGen Investment Management and its representatives are in compliance with the current registration and notice filing requirement imposed upon registered investment advisers by those states in which VestGen Investment Management maintains clients. VestGen Investment Management may only transact business in those states in which it is notice filed, or qualifies for an exemption or exclusion from notice filing requirements. This weekly update is limited to the dissemination of general information. Any subsequent, direct communication by VestGen Investment Management with a prospective client shall be conducted by a representative that is either registered or qualifies for an exemption or exclusion from registration in the state where the prospective client resides. For information pertaining to the registration status, service and fees of VestGen Investment Management, please contact VestGen Investment Management or refer to the Investment Adviser Public Disclosure web site (www.adviserinfo.sec.gov). For additional information about VestGen Investment Management, including fees and services, send for our disclosure statement as set forth on Form ADV from VestGen Investment Management using the contact information herein. Please read the disclosure statement carefully before you invest or send money.