
WEEKLY MARKET SUMMARY
Global Equities: Stocks started off last week on a strong note, posting fresh all-time highs mid-week before a sharp inflation-driven selloff erased most of those gains by Friday’s close. The S&P 500 just barely kept its seven-week winning streak intact at +0.2%, while the Nasdaq edged down -0.1% and the Dow slipped -0.1% on the week. Before pulling back, the S&P 500 and Dow briefly eclipsed the 7,500 and 50,000 marks, respectively, on Thursday. Small caps bore the brunt of the week’s selling pressure, with the Russell 2000 declining -2.3% and ending a seven-week winning streak. Foreign developed market stocks fell -2.2% while emerging market equities were also lower, declining -4.2% after a meeting between President Trump and Chinese President Xi yielded no major progress on trade or the Iran conflict.
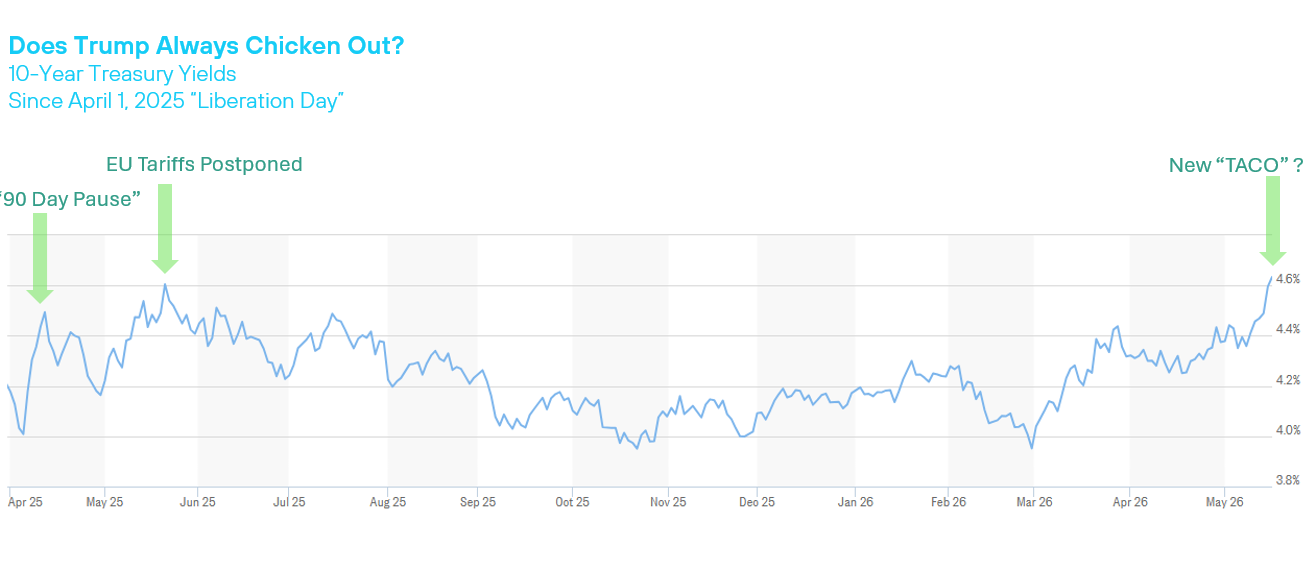
Fixed Income: Treasury yields rose to their highest level in more than a year, with the 10-Year just under 4.6% and the 30-Year crossing the 5% threshold. Friday marked the end of Jerome Powell’s tenure as Fed Chair, with Kevin Warsh formally taking the helm. While President Trump nominated Warsh with a mandate to lower interest rates, that directive has become seemingly impossible to carry out this year considering this week’s exceptionally hot inflation data. Market expectations for a 2026 interest rate cut fell to practically 0%, while odds of at least one rate hike surged to around 54%.
Commodities: The stalemate in Iran pushed oil prices higher, propelling US West Texas Intermediate to $105.42 per barrel and international benchmark Brent Crude to $109.26. The International Energy Agency warned this week that the global oil market could remain materially undersupplied through October even if the conflict resolves next month, and that only a small number of vessels have managed to transit the Strait since the conflict began.
WEEKLY ECONOMIC SUMMARY
Consumer Price Inflation: The April Consumer Price Index (CPI) report reflected the impact of higher fuel costs, which pushed the headline number up to 3.8% annually, in line with expectations. Energy costs for consumers surged 17.9% year-over-year, with Gasoline up 28.4% and Fuel Oil up 54.3%. Core inflation, ex-food and energy, was hotter than the expected 2.7%, registering a tick higher at 2.8% in April. Shelter costs surged 0.6% in April, double from the prior month and the most since January 2024. On a three-month annualized basis, CPI is trending at over 7%, an unsustainably high level that has pushed consumer sentiment to its lowest level in history.
Producer Prices Skyrocket: Investors hoping for deflationary pressures from wholesale goods and services were disappointed, as the April Producer Price Index (PPI) showed a huge spike across a range of input costs. The headline PPI number was up 1.4% in April alone, equating to a 6.0% annual rate of inflation. Energy wasn’t the sole culprit of higher input prices, either. Core PPI (ex-food and energy) was up 1.0% for the month and accelerated to 5.2% year-over-year. The rate of PPI inflation over the last three months, annualized, is approximately 11%. The uptick in input prices is an ominous sign for consumer prices as well, since a large portion of the wholesale PPI inflation works its way down to consumers eventually.
Earnings Season: The artificial intelligence trade was alive and well during the week, with shares of AI-infrastructure provider Nebius Group NV (NBIS) surging over 17% after increasing capex to meet AI demand that drove 684% revenue growth. Applied Materials (AMAT) also posted strong earnings thanks to demand for AI, growing EPS 20% and hitting 50% on gross margins. Cisco (CSCO) was another big winner after beating thanks to AI demand and also announcing plans to cut 4,000 jobs.
The week ahead: Mid-week earnings from Nvidia (NVDA) will be the main event, although several major retailers also report earnings results. Economic data highlights include minutes from Jerome Powell’s final Fed Meeting as Chair, along with fresh Consumer Sentiment data.
CHART OF THE WEEK
The Chart of the Week examines the 10-Year Treasury Yield as a possible indicator for a policy shift from President Trump on either trade or the war in Iran. Traders have coined the acronym TACO, or “Trump Always Chickens Out”, to describe the President’s tendency to reverse policy decisions abruptly when the bond market reflects distress. The initial TACO moment occurred a little more than a week after the Liberation Day tariff announcement, when the 10-Year bond yield eclipsed 4.5% and Trump initiated a pause, citing “yippy” bond markets. A test of 4.6% prompted a similar pullback from the brink and a pause in European Union tariffs. Yields had been trending back under 4% until the Iran War commenced in late March. With this week’s surge above 4.6% on the 10-Year and above 5% on the 30-Year Treasury, TACOs may be on the menu once again.